Home »

Cranbrook sales demand in first quarter up 55%
 Real Estate Update
By Jason Wheeldon
Did we catch your attention? Now we put those numbers into perspective.
Year-to-date Cranbrook has seen 45 single-family home sales within city limits compared to only 29 sales in the first quarter of 2013.
Taking you back to 2013 as a dismal reminder was one of the worst starts to the year in my history of a REALTOR ®. There were a lot of economic factors playing a role including the conversion back to GST (which some buyers thought would bring house prices down), media forecasts of an impending market correction in Canada, and new rules regarding Mortgage Qualifications taking effect from their initial implementation in the previous summer.
 The sales grid (right) shows the monthly numbers of sales going back to 2011. One can see in both March and April 2013 that sales were extremely low in relation to previous years.
Average sale price in the first quarter was $284,254 with average days to sell of 91 days. This is up marginally from the 2013 average sale price of $282,518 and an average of 97 days to sell.
 Average sale prices are not always a clear indicator of market increases due to the smaller sampling of sales in the first quarter and buyer patterns on price ranges. The graph (left) shows our 2014 sales by price range in comparison to last year. The chart shows a dramatic improvements and the largest demand in the $200,000 to $300,000 price sectors.
While the 2014 market is definitely off to a stronger start there are also some good market fundamentals with the supply of available listings.
Real Estate prices are always subject to supply and demand. Demand of course is expected to be stable this year in the local markets; however, supply has seen a continual downward trend over the past four years. Currently, as of April 3, Cranbrook has 118 single family dwellings offered for sale within city limits. There are currently 196 active detached offerings (including manufactureds, bare land strata etc.), which matches last year’s inventory.
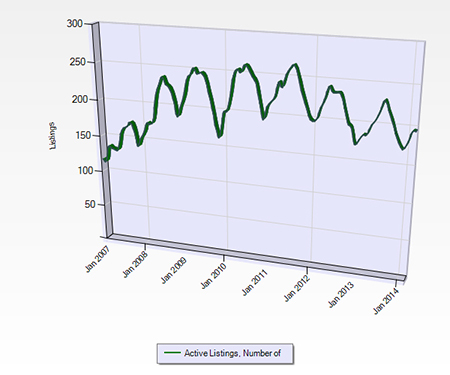 The graph (right) depicts our listing inventory over the past few years. Please note on the graph that inventory tends to spike high in April and May of each year which represents our highest inventory point of any given year.
Moving forward this year, we anticipate demand to be at average levels typical to that seen over a 20 year average. We estimate single family sales for the year to hover between 225 and 240 home sales.

The graph left shows single family sales going back to 1994. If the 2014 market predictions hold true it would reflect the average of 20 years of demand within Cranbrook. Canada Mortgage & Housing Corporation has forecasts of a 15% increase in demand in the local market over the 2013 numbers.
Real Estate is a cycle and according to Wikipedia “can be seen as a logical sequence of recurrent events reflected in demographic, economic and emotional factors that affect supply and demand for property subsequently influencing the property market. The property cycle has three recognized recurring phases of boom, slump and recovery.”
Boom Cycle:
· Rents rise to levels which place significant financial pressure on tenants;
· The time it takes for a property to sell after being listed for sale reduces markedly;
· Property prices rise;
· Yields fall as prices rise proportionally more than rents rise;
· There are few mortgagee/forced sales;
· Property finance is easy to obtain and there are a number of new lending products making borrowing easier;
· People borrow against their increased house values and spend this money on consumer items (TVs, boats, holidays, cars, etc.);
· There are many property seminars competing for investor dollars;
· Property is a hot topic in the media. Initially there is much speculation about how price growth will continue, but later in the Boom the media turns its attention to the reduced affordability of property;
· There is a lot of discussion about how this Boom will never end i.e. “it is different this time” and expectations that there will be no subsequent Slump phase.
Slump:
· Increased vacancies of rental properties;
· Reduced cash flow for investors;
· Property price growth stagnates and/or property values fall;
· The length of time to sell a property increases markedly;
· Increased number of mortgagee/forced sales;
· Property finance is more difficult to obtain;
· There is much “doom and gloom” about property values being too high in the media;
· Many property investors experience lower cash flow and sell down their property portfolios to some degree, or completely.
Recovery:
· Increased rents and cash flows;
· The length of time to sell a property reduces;
· Property prices begin to increase;
· Much confusion in the media reigns about whether recent property value growth is sustainable;
· Many potential property purchasers delay buying because they evidenced value falls or a slow market in the preceding slump;
· The cycle continues.
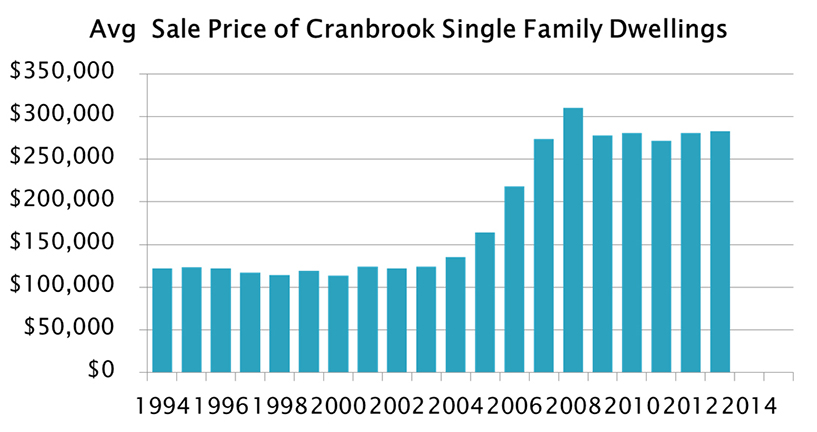 Our graph (right) showing average sale prices in the City of Cranbrook over 20 years of statistics shows how prices have performed over the different cycles of the market.
The year 2014 marks my 20th anniversary in real estate and it is safe to say that I have seen several cycles of the real estate markets locally. We see some stable demand now with buyers having increased confidence in the local markets, but more importantly we have seen reductions in supply over the past four years, which signifies a recovery.
Personally, I think it will be a number of years before the fundamentals allow for another Boom Cycle. A number of significant events in the local economy would have to take place. For now a stable market is a good thing and smaller price appreciations are good for our local market.
The first quarter of 2014 is off to an average start in comparison to previous years, but the good news…it is much better than last year.
*All graph representations are based in whole or in part on data generated by the Kootenay Real Estate Board which assumes no responsibility for its accuracy.*
– Jason Wheeldon is as committed to his profession as a REALTOR® as he is to the City of Cranbrook. He has been a top performing agent with Royal LePage East Kootenay Realty. Since he started his professional career in 1994, Jason has consistently set the bar as high as possible. Along with his outstanding performance record at Royal LePage East Kootenay Realty, Jason has also been one of the Top one per cent producers of Royal LePage Realtors in Canada. He was also the Cranbrook and District Chamber of Commerce’s Citizen of the Year in 2012, recognition for volunteerism in the community.